Webinar

The Truth About Security In Open-Source CMS

Register now →

Effective A/B Testing (Part 2)

How To Know If Your Test Is Reliable Before You Run It

Niels Christian Laursen
Written by Niels Christian Laursen

A/B testing is a powerful tool… When it works. But not every test will deliver results you can trust. In fact, many marketers launch tests without knowing whether the data they collect will be significant at all. The result? Misleading wins, misleading losses, and a whole lot of wasted effort. This post is about the shift we made from “let’s test it and see” to testing with confidence, and the simple steps you can take to make sure your test results are actually worth acting on.

In Part 1, we explored why nearly half of our early A/B tests at Umbraco failed to deliver meaningful insights: They weren’t set up for success in the first place. We were testing too much, too randomly, and often without the traffic or conversion volume needed to reach significance. 

The key takeaway? Before you run a test, make sure it can tell you something useful. Otherwise, you’re not optimizing, you’re just making noise.

How to know if your test will be reliable (and why it matters)

It’s easy to get excited when early results look promising. We’ve been there. But if a test isn’t statistically reliable, if the sample size is too small or the expected impact too minor, you’re gambling, not optimizing.

Running a test is only worth your time if the outcome helps you make a better decision. Otherwise, you’re just adding noise.

Here’s how we now approach test planning to ensure we’re collecting data we can trust.

Start with your current performance

Before you run a test, gather two numbers:

  • Monthly pageviews (or email sends, depending on the test)

  • Monthly conversions (for the metric you care about)

From this, calculate your baseline conversion rate. You'll use it as the starting point for estimating how much improvement you're trying to detect.

Example: 10,000 views and 400 conversions = 4% conversion rate.

This is the first step to knowing what’s realistic and what’s not.

Use a sample size calculator

We use a sample size calculator to determine how much data we’ll need for a reliable result. You can do this with tools like Evan Miller’s calculator, but here’s the core of how it works:

You’ll need to define:

  • Baseline conversion rate (see above)

  • Minimum Detectable Effect (MDE). How much of a conversion lift do you want to detect (e.g., 10%, 20%, 30%)

  • Statistical power and significance levels. We use 80% power and 10% significance. 

The calculator will return the number of sessions (or recipients) needed in each group. If your page or email doesn't get enough traffic to meet that number in a reasonable timeframe (say, under 6-8 weeks), it’s likely not worth testing.

ℹ️ Statistical power and significance levels
Statistical power 1−β (usually 80%) reflects how likely your test is to detect a real effect if one exists, while significance α ( typically set at 5%) tells you how confident you can be that a test result isn’t just random chance.

At Umbraco, we use an 80/10 setup to strike a balance between reliability and practicality, enough confidence to trust the results without needing massive sample sizes. If you are a purist when it comes to A/B testing, you will stick to 80% statistical power and 5% significance level. This is entirely up to you and how willing you are to take risks. If the changes you need to make from the test are very big or expensive to roll out, you would probably want to use a 5% significance level.

Be realistic about the impact

How do you determine whether your calculations are realistic or not? This is where experience and a bit of gut feeling come in. Is a 10% improvement likely from this change? Do you have similar past results to support your claim? Or are you betting on a 1-2% bump from tweaking a headline?

Here’s how we think about it:

  • If you’ve seen similar tests deliver 10-20% improvements before, the test is probably worth running.

  • If not, and the projected lift is small, you’ll need a very large sample size to prove anything, and the payoff may not be worth the effort

When in doubt, either make the change bigger (so the effect is easier to detect) or don’t run the test at all.

💡 If you’re just getting started, you’ll have to rely on your best judgment a little more than experience and data. That’s perfectly fine! You might get it wrong a few times while you’re dialing in, but even a rough estimate is better than going blind. With each test, you can refine your sense of what’s realistic and lean more on data from previous tests.. 

A practical example:

Let’s say you’re testing a new headline on your pricing page.

Your current conversion rate is 4%. You decide the smallest lift you care about is 25%, in other words, you want to detect an increase from 4% to 5%.

You plug this into a sample size calculator with a 5% significance level and 80% power, and it tells you that you’ll need around 6,500 users per variant, about 13,000 total.

If your page gets 1,500 visitors a day, you’ll need to run the test for 9 days to hit that sample size. Simple math, but crucial.

Now, what if you said, “I’d be happy with just a 0.1% improvement”? That’s technically measurable but not practically useful. You’d need hundreds of thousands of users to prove it wasn’t a fluke. And even if it was real, would that tiny bump be worth the dev hours and planning time?

That’s the key: don’t just ask “Can I detect a change?” Ask, “Is the change worth chasing?”

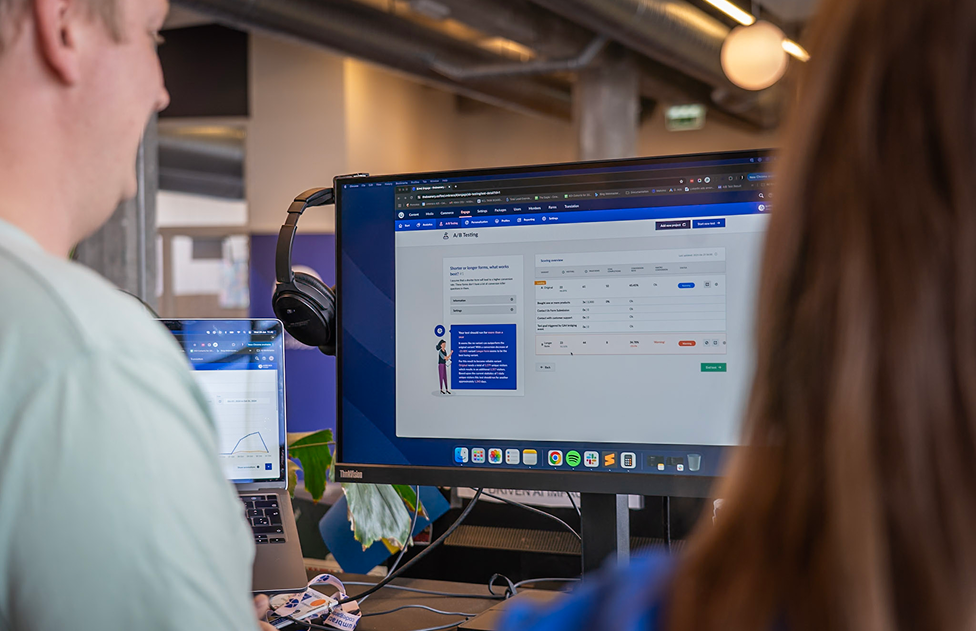
💡 If you already have data available in Umbraco Engage, the tool will help you determine this.
You can also use a sample size calculator, like the one here, to determine if your sample size is enough. We have built an AI A/B-test assistant for ChatGPT that can help you run all the numbers and get assistance on it if you prefer that.

How we use Umbraco Engage to plan smarter tests

We now use Umbraco Engage to manage our test setup. It allows us to:

  • Set clear goals and key metrics for each test

  • Calculate conversion rate based on analytics data

  • Estimate required sample sizes and duration

  • Stay focused on running tests where the outcomes can be trusted

The result? Fewer questionable results, faster conclusions, and better confidence in what we publish.

Umbraco Engage provides helpful suggestions for your running A/B tests - here’s an example from a page with a very low rate of daily visitors. I probably could have ruled out the test by simply looking at the pageviews before setting it up.

Take a product tour of Umbraco Engage

Takeaway

Before launching your next A/B test, ask yourself:

  • Do I know the baseline conversion rate?

  • Can I estimate the minimum improvement that would make the change worth it?

  • Do I have enough data (or traffic) to detect that change reliably?

If the answer to any of those is no, you may want to rethink or redesign your test. The best tests aren’t just creative. They’re grounded in solid expectations.

Coming up in Part 3

In Part 3, we’ll take a step back and look at the bigger picture: the mindset behind successful testing. Because even with great ideas and great tools, your A/B testing program won’t reach its potential if you’re still thinking “more tests = more results.”

We’ll share the four testing mindsets we’ve gone through at Umbraco and why the last one made the biggest difference.

If you want to know when part 3 is live, you can sign up to get a notification as soon as the next blog post is out:

Notify me!